
ST Engineering at S$32.5 Billion: How Much of That Value Did the Business Actually Earn?

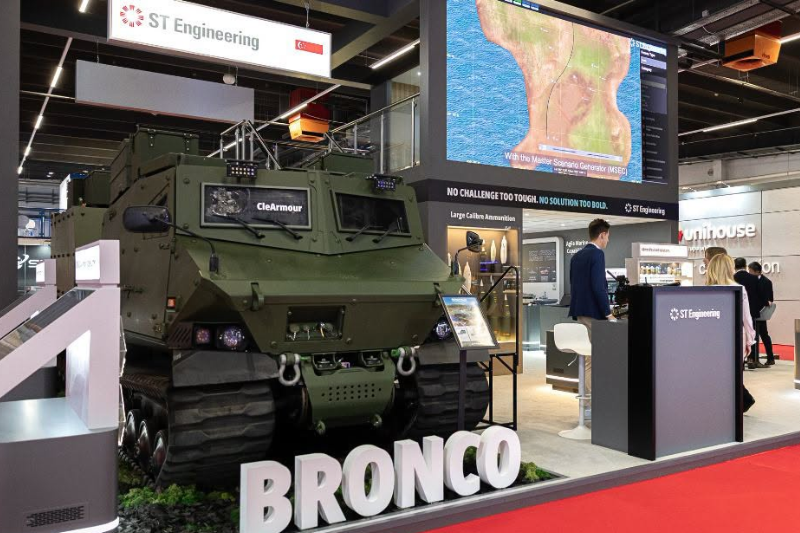
ST Engineering (SGX: S63) has tripled in market capitalisation over ten years. The question worth asking is how much of that reflects genuine business transformation — and how much reflects a market willing to pay an ever-higher price for the same underlying earnings.
The thesis here is precise: ST Engineering’s decade-long value creation rests on three real structural pillars — aerospace expansion, defence contract depth, and acquisition-led portfolio diversification — but the share price appreciation has significantly outrun earnings growth, meaning multiple expansion, not fundamental improvement alone, did the heavier lifting. Understanding the distinction matters enormously for anyone assessing what the next decade could plausibly deliver.
Start with the headline numbers, because they are genuinely impressive. Revenue nearly doubled, from S$6.3 billion in FY2015 to S$12.3 billion in FY2025 — a 95.2% cumulative rise. The order book grew even faster, from S$11.7 billion to S$33.2 billion, a 183.8% expansion that signals forward demand rather than backward achievement. Free cash flow swung from a deficit of S$12 million to a surplus of S$1.2 billion, with cumulative FCF over the decade reaching S$6.7 billion. These are not cosmetic improvements. They reflect a business that has materially changed its operating profile and its capacity to generate cash.
The aerospace segment anchors the first structural argument. A decade ago, commercial aerospace was primarily a regional maintenance, repair and overhaul operation. It now converts passenger jets into freighters, manufactures nacelles at OEM level through the 2019 acquisition of MRA Systems, and serves a global fleet base whose structural growth trajectory is essentially independent of any single airline’s fortunes. Revenue in this segment more than doubled, from S$2.1 billion to S$5.0 billion — a 138% rise — with base operating performance margins holding at approximately 9.8%. The logic is durable: aircraft require maintenance regardless of manufacturer, and a growing global fleet provides a long, compounding runway for MRO providers with genuine technical capability.
The defence and public security segment provides the second structural argument. Long-duration government contracts — covering defence systems, communications, land systems, and public safety — generate revenue visibility that few commercial businesses can match. Defence spending follows strategic planning cycles measured in years, not quarters, and recurring maintenance work compounds the earnings base over time. Global defence budgets have trended upward through the decade, and ST Engineering has been positioned to capture that structural tailwind across multiple geographies.
The third argument concerns acquisitions. Each significant deal filled a specific capability gap rather than simply adding revenue scale. Aethon in 2017 seeded the robotics capability that later anchored the urban solutions segment. Newtec and Glowlink in 2019 established real scale in satellite communications. Then came TransCore in 2021 and 2022 — the acquisition that transformed ST Engineering into a North American tolling leader and became the single largest driver of urban solutions growth since. These were not opportunistic purchases; they were deliberate moves up the value chain and across geographies.
Yet the margin data complicates the narrative. Net profit grew at only 4.9% annually. Gross margin compressed from 20.2% to 17.5%. Operating margin fell from 8.1% to 6.8%. Net margin slid from 8.4% to 6.9%. However the measure, the business earns less per dollar of revenue than it did ten years ago. The acquisitions that drove top-line growth also introduced lower-margin activities, higher integration costs, and — critically — a substantially heavier debt load. Gross borrowings rose from approximately S$1.2 billion to S$4.8 billion, net debt reached S$4.3 billion, and interest expense climbed from S$49.9 million to S$226 million. The Aaa/AA+ credit ratings remain intact, but the balance sheet is structurally different from the one that existed in 2015.
Free cash flow is where the business case looks strongest, and it deserves emphasis. Operating cash flow climbed to S$1.71 billion from S$465.5 million while capital expenditure barely moved — from S$477 million to S$506 million — meaning FCF as a proportion of net profit now stands at 141%. This is the one dimension where the group has unambiguously improved its quality, not merely its scale. Cash generation of this magnitude supports the dividend and the balance sheet simultaneously, which matters when net debt is S$4.3 billion.
The valuation question is where the analysis becomes most demanding. Market capitalisation rose approximately 225%, from S$10 billion to S$32.5 billion, while the share price moved from S$2.92 to S$10.48 — a 258.9% gain. Net profit, on a base operating performance basis, rose 60.8%. The trailing price-to-earnings ratio on reported earnings stands near 71 times; on BOP earnings, approximately 38 times. EV/EBITDA expanded from 13.4 times to 19.4 times. Multiple expansion did far more work than earnings growth. The market re-rated ST Engineering as a higher-quality, more globally diversified, more strategically relevant business — and that re-rating is not irrational, given the structural changes described above — but it does mean that a significant portion of the decade’s share price return is not repeatable through business performance alone.
Dividend yield has compressed accordingly. The payout rose from S$0.15 to S$0.23 per share — a 53.3% cumulative gain at a 4.4% compound annual rate — but yield fell from 5.1% to 2.2% because the share price ran far ahead of the dividend. An investor who bought in 2015 earns a yield on cost that a new buyer today cannot access. That asymmetry is not a criticism of management; it is a structural consequence of multiple expansion, and it is a constraint on forward return expectations for anyone entering at current prices.
The implication is direct. ST Engineering has genuinely transformed its business over ten years — through aerospace capability expansion, defence contract depth, and disciplined acquisition strategy — and the free cash flow record validates that the transformation has real economic substance. But the share price has run ahead of the earnings, and the starting valuation for the next decade is approximately four times more demanding than the one that existed in 2015. The next decade’s performance will depend less on whether ST Engineering can grow — the S$33.2 billion order book suggests it can — and more on whether it can reverse margin compression, absorb the TransCore debt load, and convert that backlog into earnings growth that justifies a multiple the market has already granted in advance.